OBD2
What is an OBD2 data logger?
What an OBD2 data logger records, the kinds there are, how often to sample, which signals to keep on every trip and how to read the log afterwards.
Speedometer
A speedometer reads faster than your actual speed mostly by design: UN Regulation No. 39, the rule Europe and many other markets apply, forbids it to show less than true speed and allows up to 10% plus 4 km/h (2.5 mph) more, so at a true 60 mph a legal dash can show 68.5 mph. The car's own speed signal is far closer: in our analysis of 303 public enviroCar trips, the OBD speed was 0.3% below phone GPS on the median trip. Worn tires add about 2% on top.
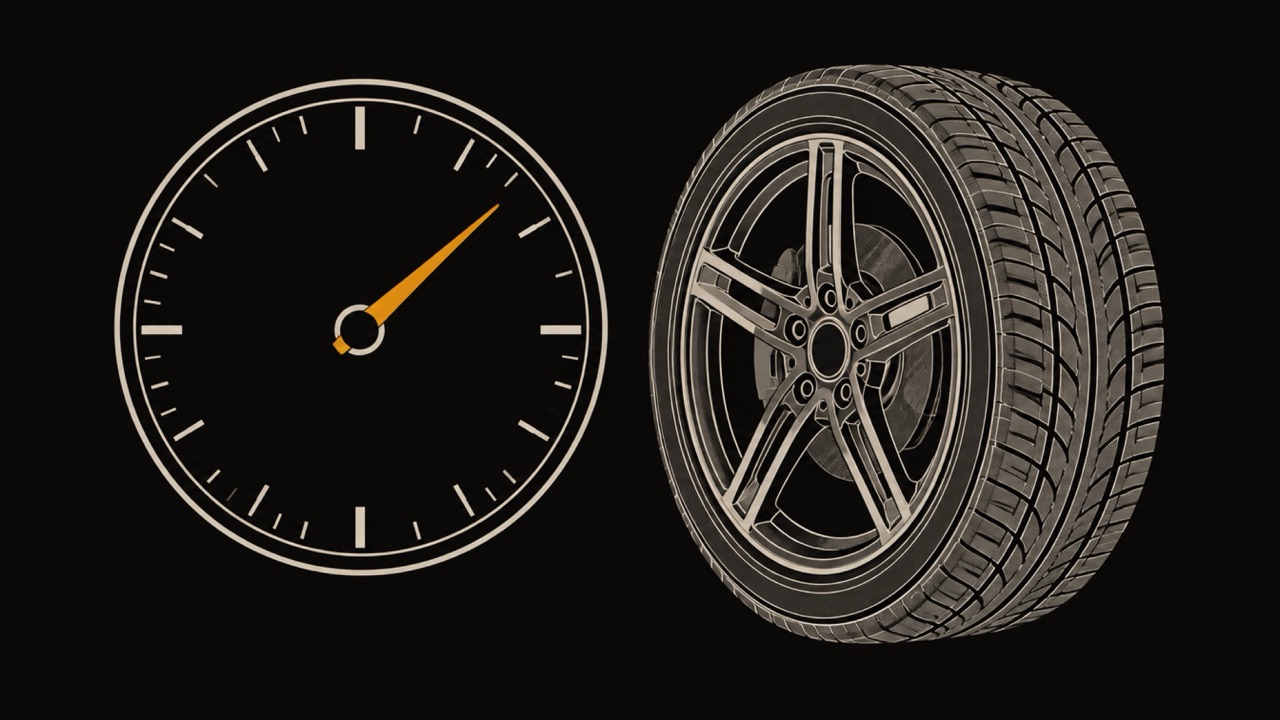
A speedometer reading faster than actual speed is normal, and three things cause it. The first is a deliberate margin: UN Regulation No. 39 says the speed indicated shall not be less than the true speed, so carmakers set the dial to err high. The second is tire wear, and the third is a tire size different from the one the car was built with.
True speed is how fast the car really covers the ground, which a phone's GPS measures well on a flat, straight road. Most cars work out speed from how fast the wheels or the gearbox output turn, then multiply by the distance one turn of the tire covers, its rolling circumference. Anything that changes that circumference changes the reading.
A road safety researcher at UNSW Sydney, Prof. Michael Regan, put it plainly in a 2023 interview: the rules forbid under-reporting, so manufacturers typically set the speedometer about 5% over, and as tires wear the speedometer overestimates speed further.
| Cause | Typical size | Direction | Why it matters |
|---|---|---|---|
| Deliberate margin | Up to 10% plus 2.5 mph allowed; about 5% targeted in Australia | Reads high | The main reason a dash shows more than a GPS app |
| Worn tread | About 2% from new tread to the wear bars | Reads high | Grows slowly over the life of a set of tires |
| Larger tires | 1.4% to 6.6% for common upsizes | Reads low | Can push the dial below true speed, which the margin was meant to prevent |
| Smaller tires | Mirror image of larger tires | Reads high | Adds to the deliberate margin |
| The car's speed signal itself | 0.3% below GPS on the median trip | Either way | The engine computer's own figure is close to true speed |
Sources: UN Regulation No. 39 (EUR-Lex), UNSW Newsroom (November 2023), our tire calculations and our analysis of enviroCar data (ODbL, Source: enviroCar contributors).
Under UN Regulation No. 39, a speedometer may read between zero and 10% plus 4 km/h above true speed, written as 0 ≤ V1 − V2 ≤ 0.1 V2 + 4 km/h, where V1 is the speed shown and V2 the true speed. It is tested on the tires normally fitted to the car, unladen, at 23 ± 5 °C, with true speed measured to within 0.5%. Reading even 1 mph slow fails it.
Worked out in miles per hour, the ceiling is wider at low speed in percent and wider at high speed in mph. At a true 30 mph a legal dash may show 35.5 mph; at 60 mph, 68.5 mph; at 75 mph, about 85 mph. In metric, 100 km/h true may read up to 114 km/h.
The United States has no such tolerance for passenger cars. The Federal Motor Vehicle Safety Standards in 49 CFR Part 571 mention a speedometer only in the motorcycle controls and displays standard, with no accuracy figure. Trucks and buses are covered elsewhere: 49 CFR 393.82 requires a bus, truck or truck-tractor speedometer to be accurate within plus or minus 5 mph at 50 mph.
| True speed | Highest reading allowed | Over-read allowed | Over-read in percent |
|---|---|---|---|
| 30 mph | 35.5 mph | 5.5 mph | 18.3% |
| 45 mph | 52.0 mph | 7.0 mph | 15.5% |
| 55 mph | 63.0 mph | 8.0 mph | 14.5% |
| 60 mph | 68.5 mph | 8.5 mph | 14.1% |
| 65 mph | 74.0 mph | 9.0 mph | 13.8% |
| 70 mph | 79.5 mph | 9.5 mph | 13.6% |
| 75 mph | 85.0 mph | 10.0 mph | 13.3% |
| 80 mph | 90.5 mph | 10.5 mph | 13.1% |
Computed from paragraph 5.3 of UN Regulation No. 39: 10% of true speed plus 4 km/h. The lower limit is zero in every row.
Speedometer accuracy has two parts: the speed the car measures, and what the dashboard shows. The first part is public on the diagnostic port as OBD-II parameter 0D, vehicle speed, the reading an OBD2 data logger records. It is not the needle: the deliberate margin is usually added by the instrument cluster, so this signal shows what the car knows before that margin.
We compared that signal with GPS on real trips from enviroCar, an open citizen science platform whose users upload drives with OBD readings and the phone's GPS. The data is published under the Open Database License (ODbL); Source: enviroCar contributors. Of the 36,831 public trips listed on November 8, 2026, we drew 450 trips of 8 to 120 km, at most three per car, recorded between 2014 and 2026.
Our analysis kept only steady driving, where GPS speed is trustworthy: samples every 5 seconds, both speeds above 30 km/h (19 mph), GPS accuracy within ten meters, and less than 0.3 m/s² of speed change across neighbouring samples. 303 trips from 210 car profiles kept thirty or more such samples, 60,297 in all.
The result: on the median trip, the OBD speed read 0.28% below GPS, about 0.2 mph at 60 mph. The middle half of trips fell between 1.33% below and 0.91% above, 77% of trips were within 2% and 91% within 3%. The OBD figure read lower than GPS on 54% of trips, so the signal does not lean high the way the needle does. A stricter GPS filter (five meters) gave a median of 0.41% below.
| GPS speed band | Trips | Steady samples | Median difference, OBD vs GPS | Middle half of trips | Trips where OBD read lower |
|---|---|---|---|---|---|
| All, above 19 mph (30 km/h) | 303 | 60,297 | -0.28% | -1.33% to +0.91% | 54% |
| 19 to 31 mph (30 to 50 km/h) | 267 | 19,867 | -0.23% | -1.53% to +0.84% | 54% |
| 31 to 50 mph (50 to 80 km/h) | 278 | 20,992 | -0.35% | -1.26% to +0.93% | 58% |
| 50 to 75 mph (80 to 120 km/h) | 162 | 13,838 | -0.19% | -1.40% to +1.01% | 53% |
| Above 75 mph (120 km/h) | 73 | 5,600 | -0.38% | -1.53% to +0.51% | 59% |
Our analysis of enviroCar public trips, downloaded November 8, 2026. Data under the Open Database License (ODbL), Source: enviroCar contributors. A trip counts in a band with at least ten steady samples there.
The car's speed signal differs a little from car to car, but rarely by much. Taking the median of each car's trips in our enviroCar analysis, about half of the 210 car profiles read within 1% of GPS and four in five within 2%. Only 17 cars, 8%, were more than 3% off in either direction, with the extremes at 6.1% below and 6.6% above.
A car profile is a vehicle as an enviroCar user registered it, so one physical car can appear twice. Makes with seven or more profiles all landed within about 1.3% of GPS on their median. The per-make medians are small samples and say more about the spread inside each make than about the makes themselves: no make reads consistently high or low.
| Make | Car profiles | Median difference, OBD vs GPS | Middle half of cars |
|---|---|---|---|
| Volkswagen | 40 | -0.09% | -0.91% to +1.09% |
| Opel | 25 | +0.79% | -0.54% to +1.21% |
| Ford | 17 | -0.67% | -1.68% to -0.43% |
| Skoda | 17 | +0.20% | -0.94% to +0.94% |
| Audi | 14 | -1.28% | -2.11% to -0.11% |
| BMW | 10 | +0.75% | -1.54% to +1.53% |
| Renault | 10 | -0.16% | -2.18% to +0.88% |
| Toyota | 7 | -0.56% | -0.76% to +0.36% |
| Seat | 7 | -0.34% | -2.65% to -0.27% |
Our analysis of enviroCar public trips (ODbL, Source: enviroCar contributors). Each car's figure is the median of its trips; make names merged where users spelled them differently.
Larger tires make your speedometer read slower than your true speed. A bigger tire covers more ground per turn, but the car still counts turns as if the original tire were fitted, so it under-reports. Smaller tires do the opposite and read faster. The size of the error equals the change in overall diameter, worked out from the size printed on the sidewall.
As an example calculation, a 225/45R17 tire is 225 mm wide with a sidewall 45% of that width on a 17-inch wheel, about 24.97 inches tall. Swapping to 225/50R17 makes the tire 3.55% taller, so the dash shows 60 mph at a true 62.1 mph. On a pickup built for 265/70R17, a 285/75R17 upgrade is 7.04% taller and shows 60 mph at a true 64.2 mph, below true speed, which a new car's speedometer may not show under UN Regulation No. 39.
| Tire size | Overall diameter | Change vs stock size | Speedometer error | True speed when the dash shows 60 mph |
|---|---|---|---|---|
| 225/45R17 (stock, car) | 24.97 in | 0% | 0% | 60.0 mph |
| 225/40R18 | 25.09 in | +0.46% | -0.46% | 60.3 mph |
| 235/45R17 | 25.33 in | +1.42% | -1.40% | 60.9 mph |
| 245/40R18 | 25.72 in | +2.98% | -2.89% | 61.8 mph |
| 225/50R17 | 25.86 in | +3.55% | -3.43% | 62.1 mph |
| 265/70R17 (stock, truck) | 31.61 in | 0% | 0% | 60.0 mph |
| 285/70R17 | 32.71 in | +3.49% | -3.37% | 62.1 mph |
| 285/75R17 | 33.83 in | +7.04% | -6.58% | 64.2 mph |
Example calculation: overall diameter = wheel diameter + 2 × width × aspect ratio, on new tires. Real tires vary slightly by brand and inflation.
Worn tires make a speedometer read faster, by about 2% over the life of a set. Tread is part of the tire's height, so as it wears the rolling circumference shrinks and the wheel turns more often per mile. Federal tire standards put treadwear indicators at 2/32 inch (1.6 mm), according to NHTSA's 1996 notice in the Federal Register.
As an example calculation, assume a new 225/45R17 with 8 mm (about 0.31 inch) of tread worn down to the 1.6 mm wear bars. The diameter loses 12.8 mm, the circumference shrinks 2.02%, and the speedometer reads 2.06% fast: 61.2 mph shown at a true 60. Each millimeter of tread is worth about 0.3%. On a taller 265/70R17 truck tire the same wear is worth 1.62%.
Wear stacks on top of the factory margin. A speedometer set 3% high on new tires reads about 5% high on worn ones, 63.1 mph at a true 60 in this example. Fitting new tires brings the reading back down, which is why a speedometer can seem to slow after a tire change.
Check a speedometer against GPS at a steady speed on a flat, straight road with an open sky, because GPS speed is least accurate on steep grades, as Prof. Regan noted for UNSW. A passenger holds the phone or a mounted GPS app does the reading; the driver keeps watching the road. The same method works for a GPS speedometer on CarPlay gauges.
Speedometer calibration means telling the car how far it travels per turn of the wheel or the gearbox output. It is needed after a tire size change like those in the table above, not for the factory margin, which is intended. On a modern car the setting lives in a control module and is changed by a dealer or a programming tool made for that vehicle; older cable-driven speedometers used a different drive gear.
How to calibrate a speedometer starts with measuring the error, using the GPS method above, then asking a dealer or tire shop whether your model accepts a new tire size setting. A phone app cannot recalibrate the dashboard: it can only show you a second, independent speed to compare with the needle.
The enviroCar figures measure the car's speed signal against GPS, on real trips, across many cars. They do not measure the needle, and they come from volunteers' phones and adapters rather than a test track.
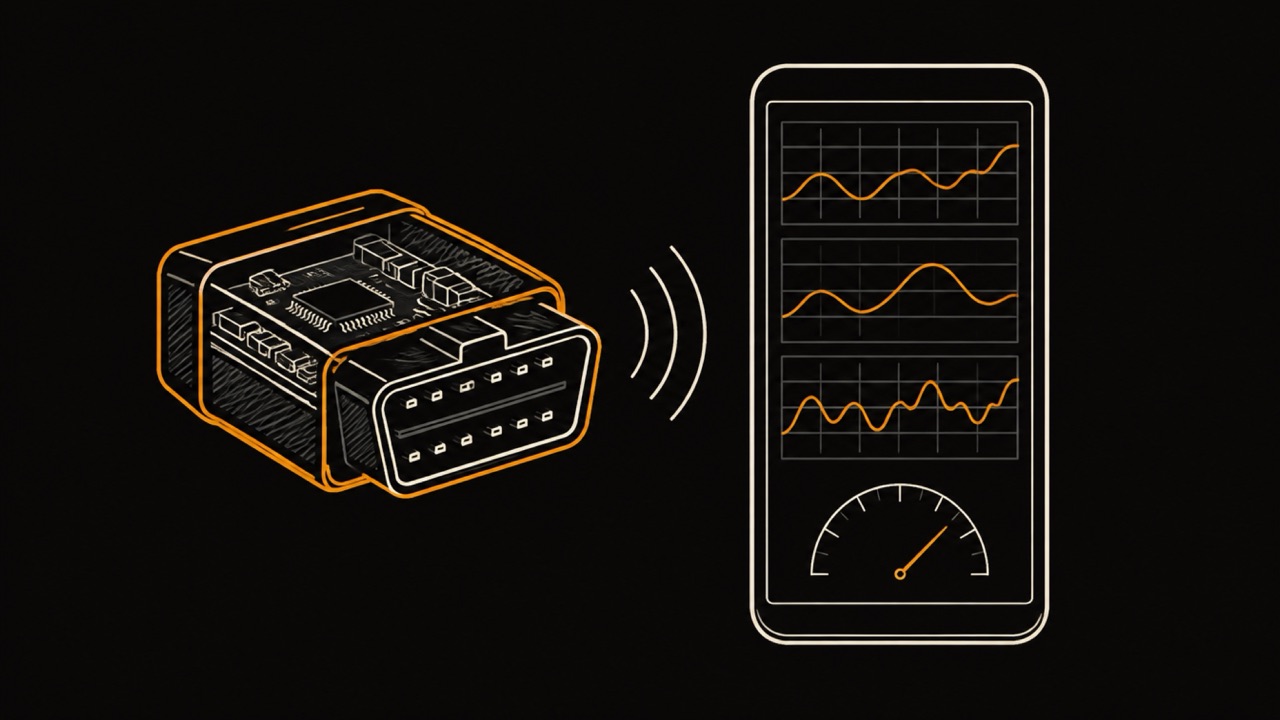
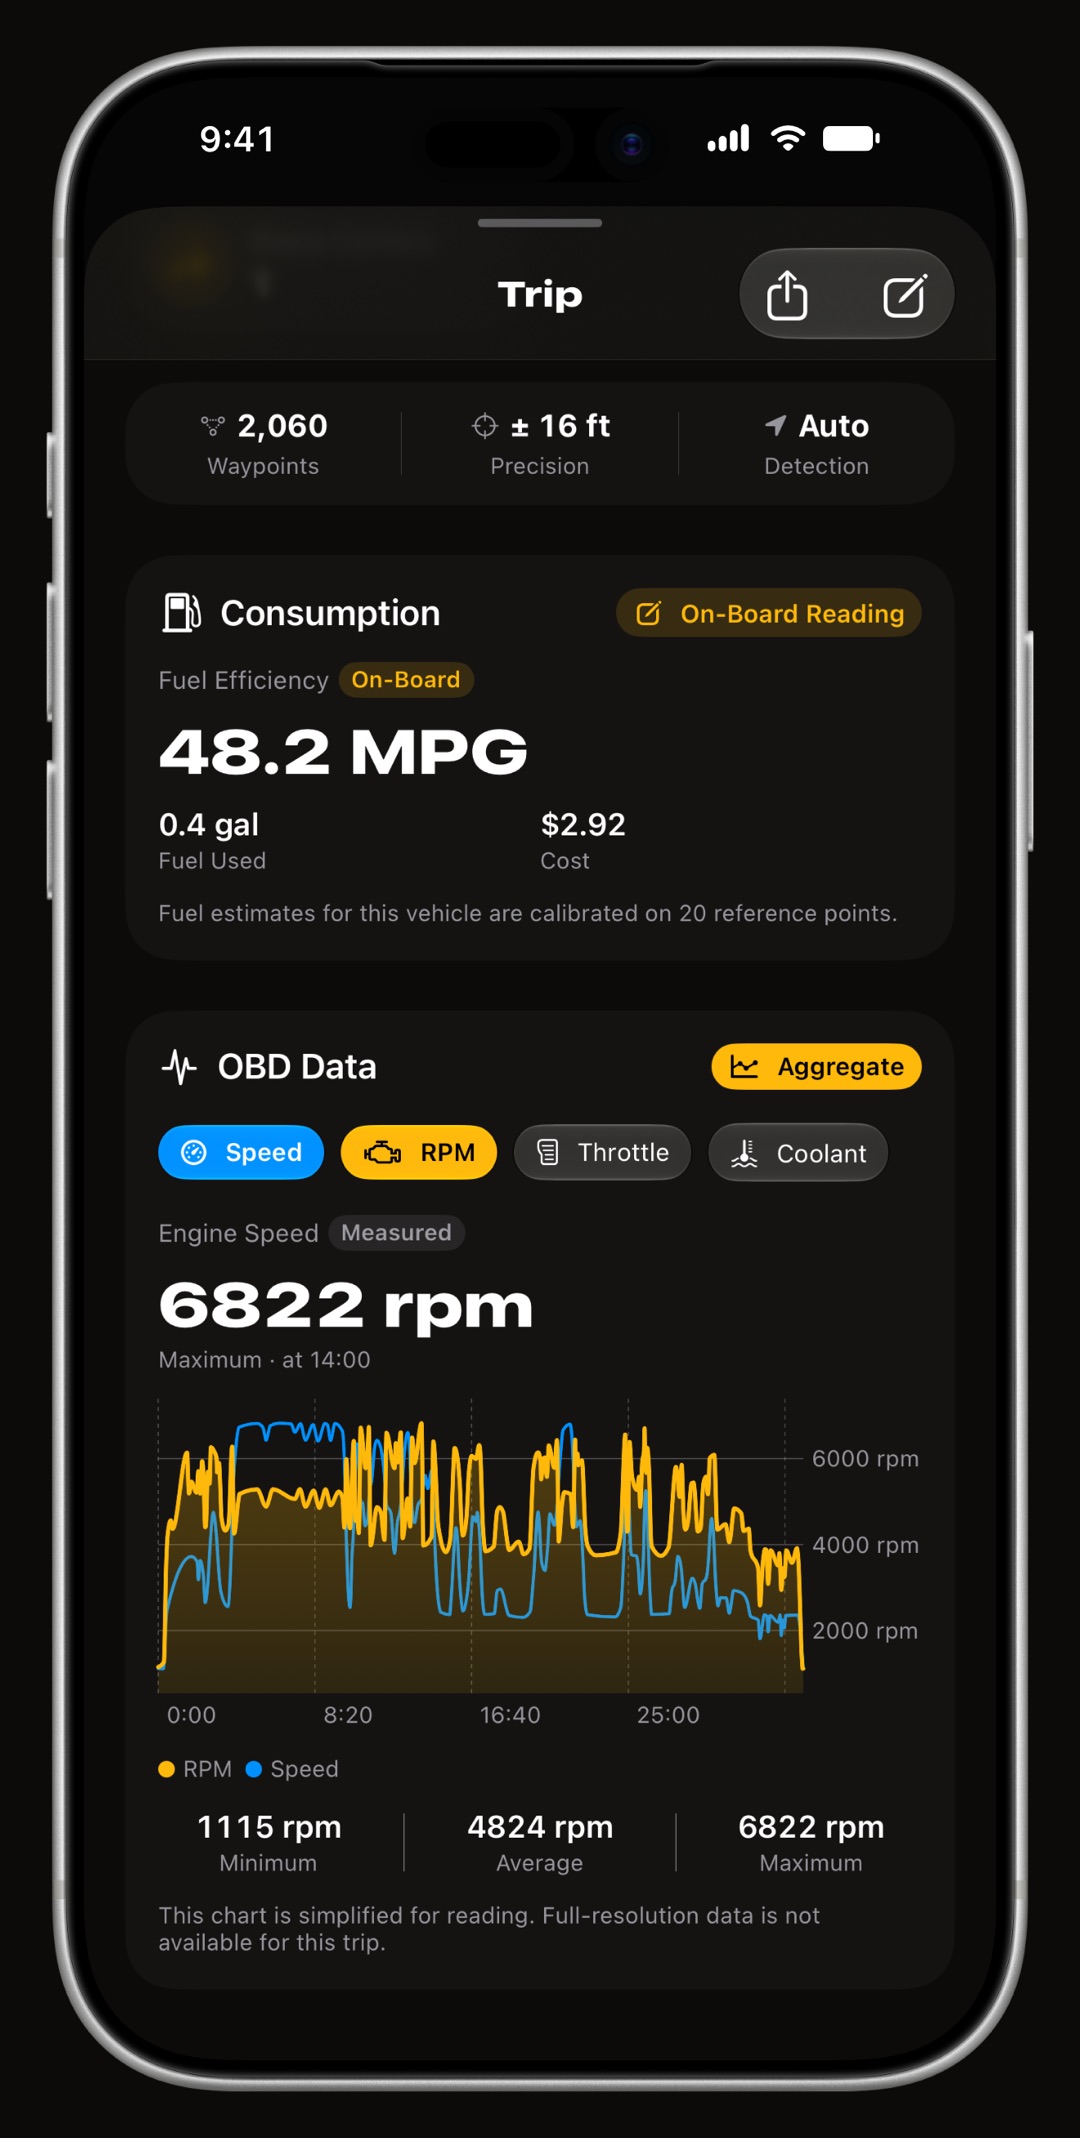
The quickest way to see your own car's numbers is to put GPS speed and the car's speed signal on one screen. WrenchTime, an iPhone app for car and motorcycle logs, shows speed from the iPhone's GPS on its full-screen Live dashboard, and with a Bluetooth OBD-II adapter a signal card draws the car's vehicle speed reading beside it, read up to 8 times a second.
Drive at a steady speed and compare both with the needle: the gap between GPS and the signal is the car, the gap between the signal and the needle is the dashboard. The free version gives you 3 instruments on the first page, and OBD-II live data is free. The car dashboard app guide shows the board, and the OBD-II app for iPhone guide covers the adapter.
Rarely exactly. Under UN Regulation No. 39 a speedometer must never show less than true speed and may show up to 10% plus 4 km/h (2.5 mph) more, so most read slightly high. In our enviroCar analysis, the car's own OBD speed signal sat 0.3% below GPS on the median trip.
Larger tires make the speedometer read slower than your true speed, because each turn covers more ground than the car assumes. Going from 265/70R17 to 285/75R17 makes the tire 7.04% taller, so the dash shows 60 mph at a true 64.2 mph. Smaller or worn tires make it read faster.
Measure the error first, against GPS at a steady speed on a flat road. On a modern car the correction for a new tire size is a setting in a control module, changed by a dealer or a programming tool made for that vehicle. Older cable-driven speedometers used a different drive gear.
At 75 mph, reading 10 mph high is the most UN Regulation No. 39 allows: 10% of true speed plus 4 km/h. At 60 mph the ceiling is 8.5 mph, so 10 mph over is outside that rule. Reading 10 mph slow is never allowed and usually points to oversized tires or a fault.
The legal ceiling under UN Regulation No. 39 is 10% plus 4 km/h, 8.5 mph at a true 60 mph. In practice it is smaller: a UNSW road safety professor says manufacturers in Australia typically aim for about 5% over. Worn tires add about 2% on top.
More from the blog
OBD2
What an OBD2 data logger records, the kinds there are, how often to sample, which signals to keep on every trip and how to read the log afterwards.
Driving dynamics
What a g force meter for cars reads, how to calculate g yourself, and how many g normal driving, a sports car and Formula One really pull.
CarPlay
How to see live OBD2 readings such as RPM, boost and coolant temperature on CarPlay, why most apps show a list, which apps draw gauges, and which adapters work with iPhone.
Free to download. One vehicle, real features, no ads. Your garage will thank you.
Download WrenchTime on the App Store