Diagnostics
How to use an OBD2 scanner
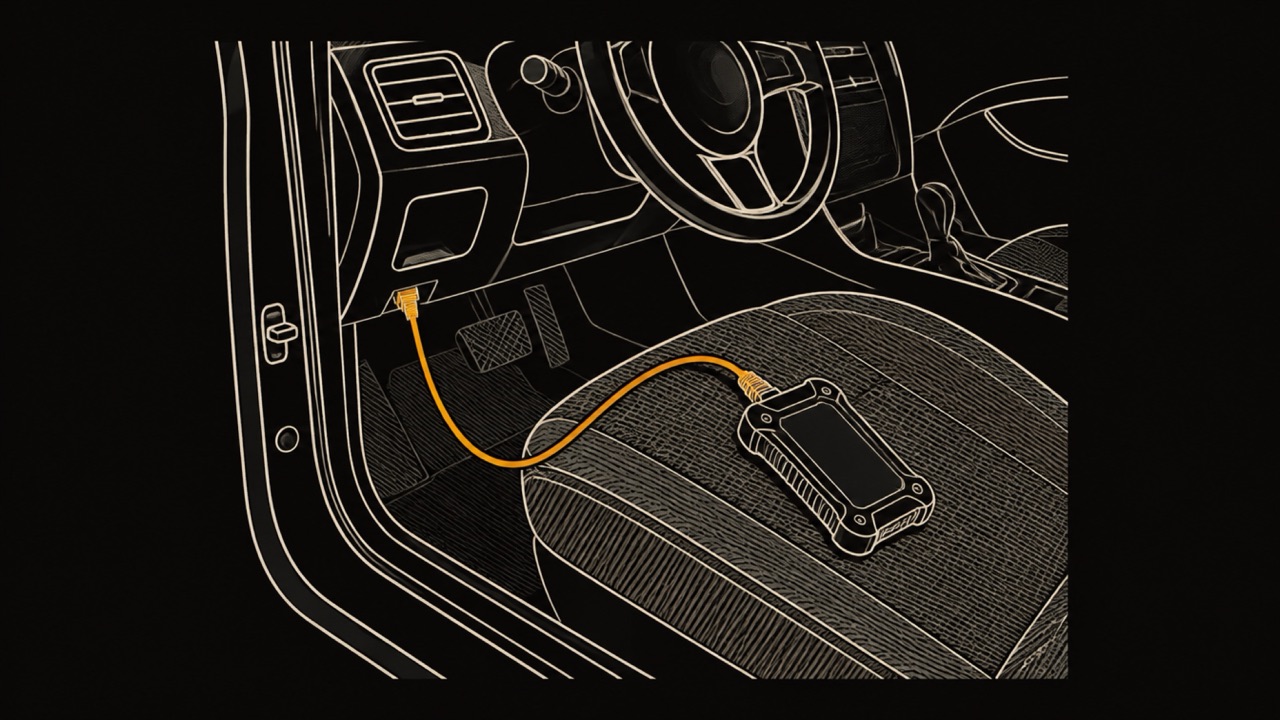
Plug in with the ignition off, switch to on without starting the engine, read and write down every code, and look each one up before clearing anything.
OBD2
An OBD2 data logger is a device or app that saves the readings your car's engine computer reports through the diagnostic port, such as RPM, speed and coolant temperature, as a time series to review after the drive. Every gasoline car and light truck sold in the US since the 1996 model year has that port, according to the California Air Resources Board. For everyday trips, one sample per second per signal is enough: an average US driver's day, 60.4 minutes according to the AAA Foundation, is 3,624 samples per signal.
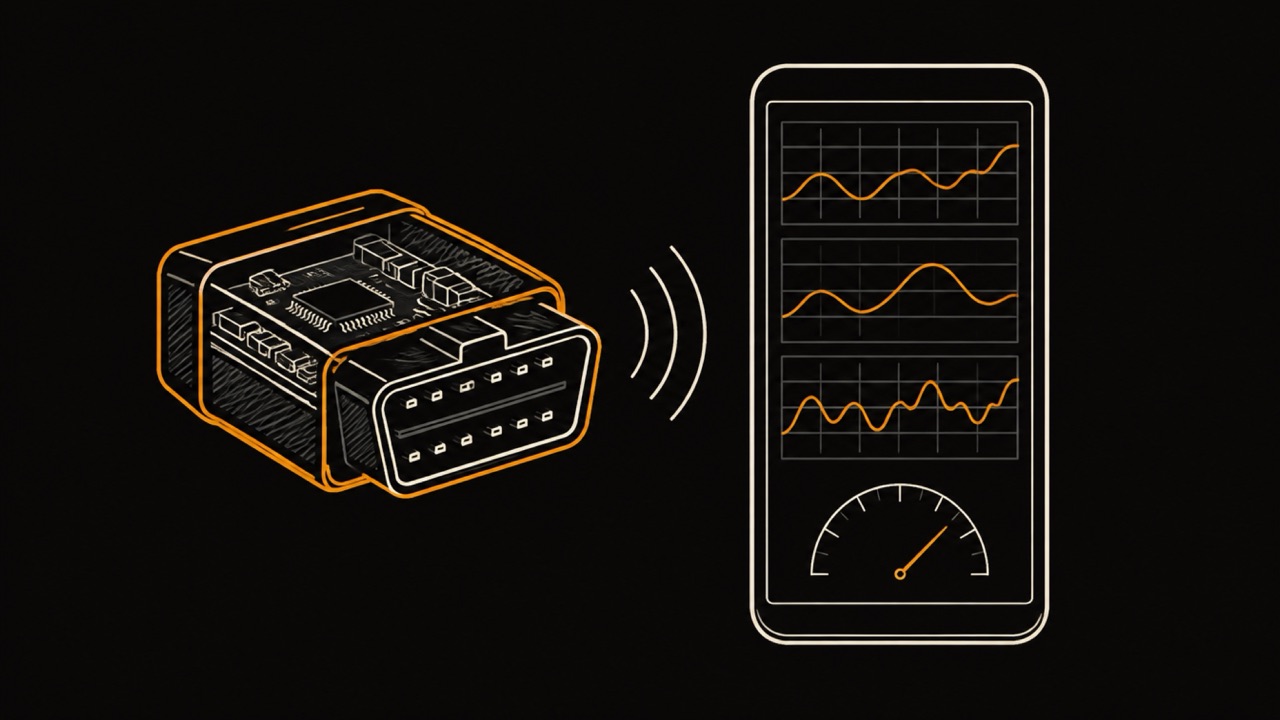
An OBD2 data logger records the parameters a car's engine computer publishes on request through the diagnostic port. The requests and their meaning are standardized in SAE J1979, the standard that defines the emissions-related diagnostic services between a vehicle's OBD system and test equipment. Each reading is identified by a parameter ID, or PID: one code for engine RPM, another for vehicle speed, another for coolant temperature.
A logger asks for a set of PIDs over and over, stamps each answer with the time, and saves the result as a time series: a list of values with the moment each one was read. The usual readings are engine RPM, vehicle speed, engine load, throttle position, coolant and intake air temperature, fuel trims, fuel rate and the control module's voltage. Many loggers also save stored trouble codes and the VIN.
A car only answers the PIDs it supports, so the list a logger can record changes from one vehicle to the next. A good logger asks the car which PIDs it supports first and requests only those. Reading and clearing trouble codes is a separate job, covered in how to use an OBD2 scanner.
OBD2 data loggers come in five kinds, and the difference that matters most is where the data ends up. A memory card logger keeps it in the box, a phone app keeps it on the phone, an insurance dongle sends it to the insurer. The right kind depends on whether you want to review your own drives, record a track day, or troubleshoot one fault.
| Kind | Where the data goes | Needs a phone | Best for | Why it matters |
|---|---|---|---|---|
| Memory card logger | A memory card inside the device | No | Long unattended recording, fleets, engineering work | Records with no phone in the car, but you pull the card and convert the files yourself |
| Bluetooth adapter plus phone app | The phone, and wherever the app syncs it | Yes | Everyday drives, reviewing trips on the phone | Cheapest setup, and the phone adds GPS position, so readings come with a route |
| Track dash logger | The dash unit, then a computer | No | Track days and lap analysis | Built for laps and sectors rather than commutes |
| Insurance telematics dongle | The insurer's servers | Sometimes | Usage-based insurance discounts | You do not own or see the raw log; the insurer decides what it means |
| Handheld scanner with a record function | The scanner's memory | No | Capturing one fault while it happens | Good for a short session, awkward for logging every trip |
OBD2 data has no position in it. The engine computer reports how fast the car is going and how hot the coolant is, never where the car is. A coolant spike or a burst of high RPM means little until you can see that it happened on a long climb, in a traffic jam or on a highway on-ramp.
The phone fills that gap. GPS.gov puts a GPS-enabled smartphone's accuracy at typically within a 4.9 m (16 ft) radius under open sky, worse near buildings, bridges and trees. That is plenty to place every reading on the road it came from, which is why a phone-based logger that records the route and the engine readings on one clock answers more questions than either one alone.
The simplest way to get both is to let the trip start the logger. An app with automatic trip recording starts listening when the car stereo connects and begins the trip once the car starts moving, and an OBD2 session that opens and closes with that trip leaves nothing to remember before you drive.
For a trip log, one sample per second per signal is enough. Speed, RPM and temperatures change over seconds, not milliseconds, and a once-a-second series still shows every acceleration, every gear change in the RPM trace and every warm-up curve. Faster rates are worth it on a live gauge, where a needle that updates three to eight times a second looks smooth.
The data volume stays small at that rate. The AAA Foundation's American Driving Survey: 2024 found that drivers averaged 2.44 trips, 60.4 minutes and 31.1 miles a day. The example calculation below turns those 60.4 minutes, or 3,624 seconds, into samples per day at three rates.
| Sample rate | Samples per signal per day | Ten signals per day | Why it matters |
|---|---|---|---|
| One per second | 3,624 | 36,240 | Enough for a trip log, small enough to keep with every trip |
| Three per second | 10,872 | 108,720 | Smooth live gauges; triple the storage for a log |
| Eight per second | 28,992 | 289,920 | Live gauges at their smoothest; rarely needed in a saved log |
Driving time: AAA Foundation for Traffic Safety, American Driving Survey: 2024 (December 2025). Samples computed as 60.4 minutes x 60 seconds x rate.
Nine standard OBD2 signals cover most of what an everyday trip log is for: how the engine was used, how it warmed up, and how much fuel it burned. Fuel trim, one of them, is the correction the engine computer applies to the fuel it injects, short term from moment to moment and long term as a learned offset.
| Signal | What it shows | Why it matters |
|---|---|---|
| Engine RPM | How fast the crankshaft turns | Shows how hard the engine worked and how long it idled |
| Vehicle speed | Speed as the car measures it | Lines the engine readings up with what the car was doing |
| Engine load | How much of the available power was used | Separates gentle cruising from climbs and hard acceleration |
| Throttle position | How far the throttle is open | Shows how the pedal was used, independent of speed |
| Coolant temperature | Engine temperature | The warm-up curve and any overheating show here first |
| Intake air temperature | Temperature of the air entering the engine | Explains changes in power and consumption on hot days |
| Fuel rate | Fuel flowing to the engine right now | Turns a drive into fuel used, minute by minute |
| Short and long term fuel trim | The computer's correction to the fuel mixture | A trim that drifts over weeks points at a leak or a sensor |
| Control module voltage | Voltage at the engine computer | A weak battery or charging fault shows at engine start |
Reading an OBD2 trip log starts with the coolant temperature trace. It should climb steadily from the start of the drive and then flatten; a curve that keeps climbing, or one that never reaches the flat part on longer drives, is worth a closer look. Short trips that end before the flat part are a pattern too, because a cold engine works less efficiently. Real warm-up curves from logged cold starts, by outside temperature, are in how long you should let your car warm up.
Idle time is the second thing to find: stretches where RPM sits low and speed reads zero. According to fueleconomy.gov, idling can use a quarter to a half gallon of fuel per hour, depending on engine size and AC use. As an example calculation, ten minutes of idling a day comes to 0.042 to 0.083 gallons, or about 10.4 to 20.8 gallons over 250 driving days.
Throttle, load and speed together show driving style. Fueleconomy.gov says aggressive driving lowers gas mileage by roughly 15% to 30% at highway speeds and 10% to 40% in stop-and-go traffic, and that each 5 mph over 50 mph is like paying an additional $0.30 per gallon. A log makes both visible: sharp throttle spikes followed by braking, or long stretches above 50 mph.
Voltage and fuel trims are slower signals, best read across many trips rather than one. Compare the voltage at engine start from week to week, and compare long term fuel trims across a month. A steady drift in either is the kind of change a single drive cannot show and a log of every trip can.
Logging OBD2 data on an iPhone takes a Bluetooth Low Energy adapter, or an Apple-certified one, and an app that records while you drive. Adapters that pair from iOS Settings over classic Bluetooth, and Wi-Fi adapters, often do not work with iPhone apps, so check which OBD-II adapters work on iPhone before buying one.
WrenchTime, an iPhone app for car and motorcycle logs, works as a trip logger. With a BLE ELM327-compatible adapter or the OBDLink MX+ linked to a vehicle, an OBD-II session opens when a trip starts and closes when it ends, every channel you choose to record is binned at one sample per second, and the series is stored with the trip next to its GPS route. The OBD-II app for iPhone guide covers what it reads.
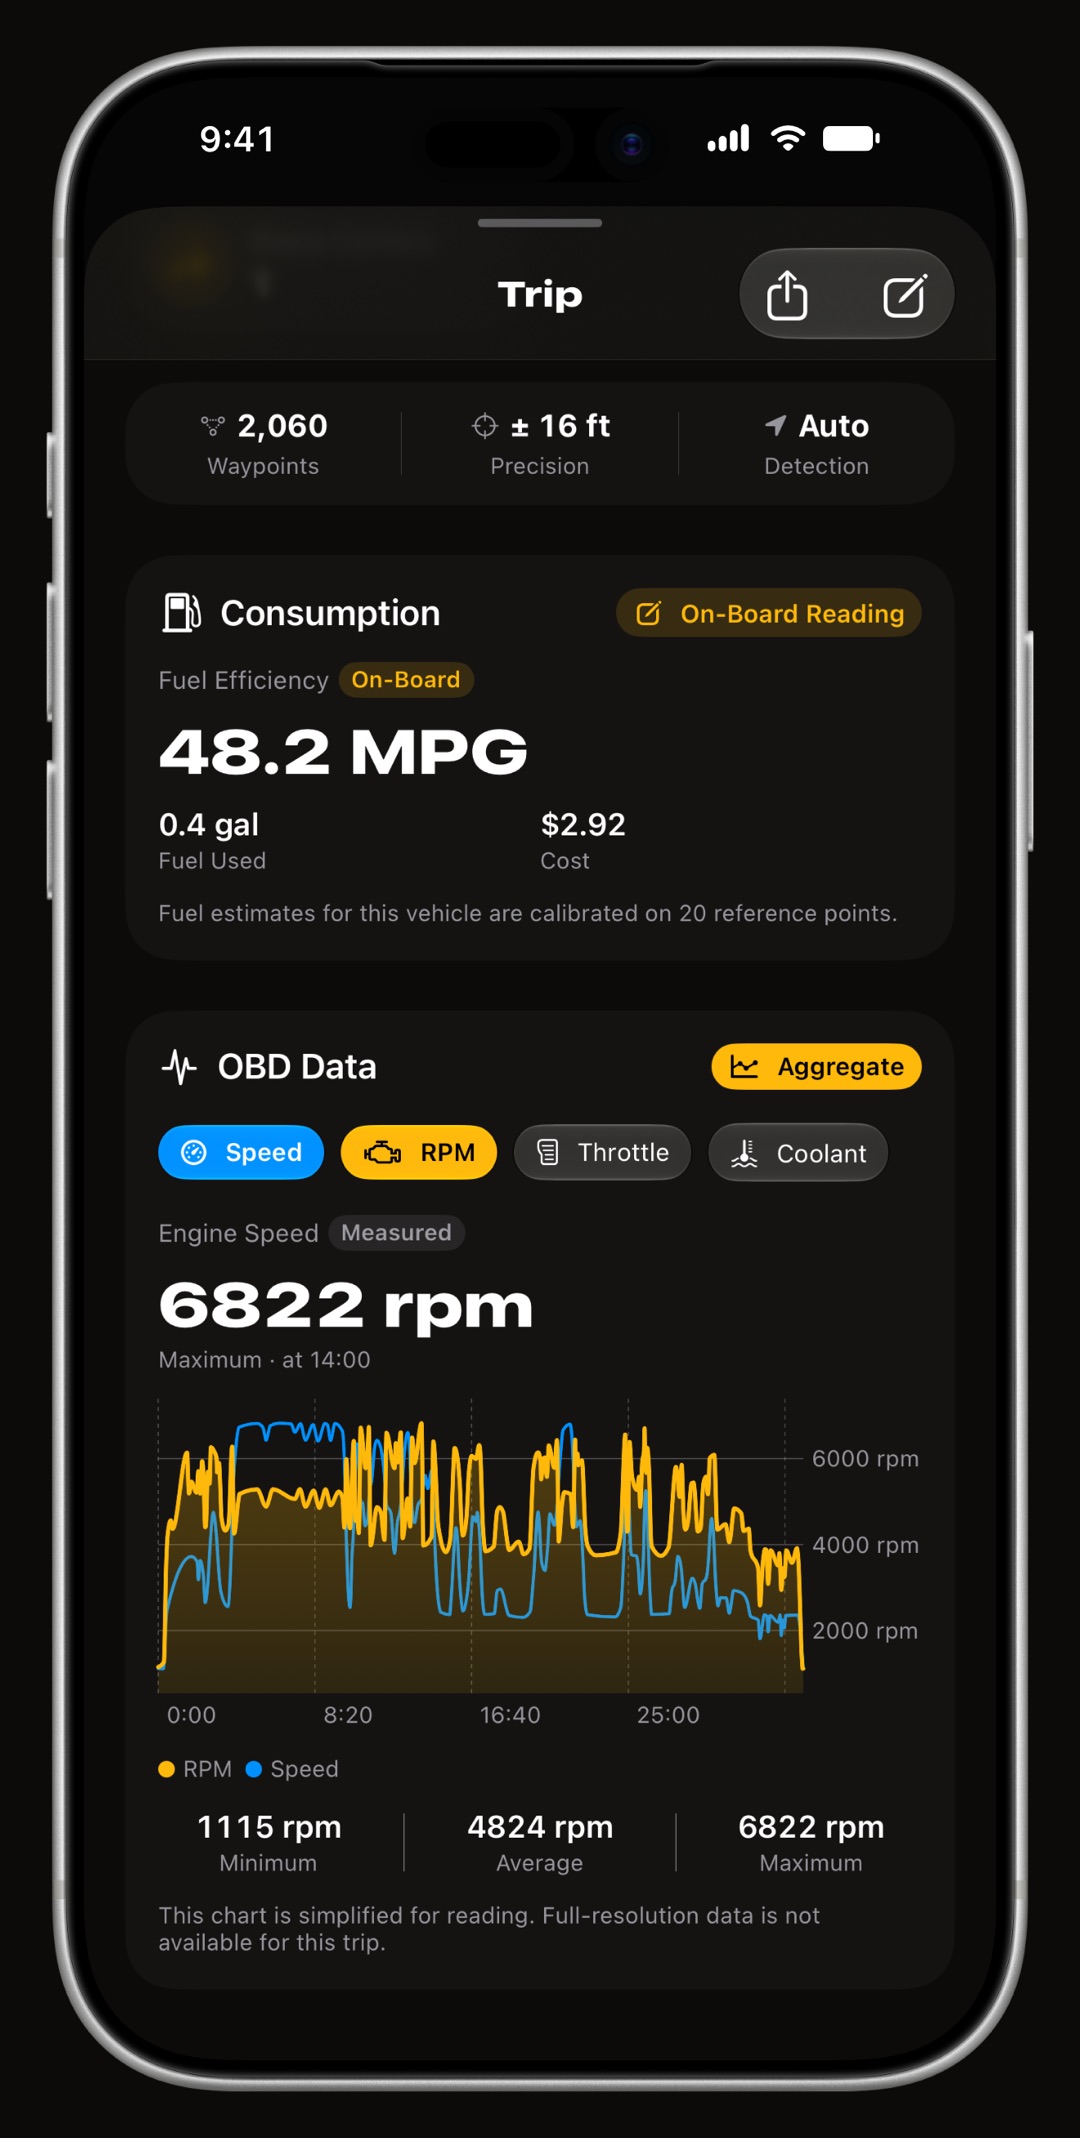
Where logged OBD2 data goes depends on the logger, and it is worth checking before you plug one in. A memory card logger keeps everything in the box until you copy it off. An insurance telematics dongle sends trips to the insurer, which is the point of a usage-based policy. A phone app keeps the log wherever the app stores and syncs it.
WrenchTime keeps the adapter link and the learned vehicle profile in the phone's own settings, and the recorded telemetry travels with the trip through your own iCloud account. There is no WrenchTime account and no WrenchTime server in the path. Telemetry has its own retention period, so old engine readings can be pruned while the trips and routes stay.
Pair a BLE adapter, link it to your car and drive: the next trip comes back with its route and its engine readings on one timeline, ready to scrub through or export as CSV or PDF. OBD-II live data and the trip export are included in the free version, which records 10 trips a week; trip route maps and overlaying several channels on one chart are part of WrenchTime Pro. The OBD-II app for iPhone guide has the full list of readings and supported adapters.
OBD2 gives live readings the engine computer publishes under SAE J1979, such as RPM, vehicle speed, engine load, throttle position, coolant and intake air temperature, fuel trims and module voltage, plus stored trouble codes and the VIN. A car answers only the readings it supports, so the list varies by vehicle.
A plugged-in adapter draws a small current from the port, and on many cars the port stays powered with the engine off. For a car driven every day this is rarely a problem. For a car parked for weeks, unplug the adapter or use one that sleeps on its own.
Yes. You need a Bluetooth Low Energy adapter or an Apple-certified one, and an app that records while you drive. Classic Bluetooth adapters that pair from iOS Settings and Wi-Fi adapters often do not work, so check the app's adapter list before buying.
At one sample per second, a 30-minute trip is 1,800 samples per signal. An average US driver's day of driving, 60.4 minutes in the AAA Foundation's 2024 survey, is 3,624 samples per signal, small enough to keep with every trip.
OBD stands for On-Board Diagnostics. OBD II is the second generation, required on gasoline cars and light trucks from the 1996 model year in the US, which is why one adapter fits almost any car sold in the US since.
Often, yes. Many usage-based insurance devices plug into the OBD2 port and log your trips, but they report to the insurer, and you do not see the raw data. A logger you own keeps the data with you, and you decide what to record and how long to keep it.
More from the blog
Diagnostics
Plug in with the ignition off, switch to on without starting the engine, read and write down every code, and look each one up before clearing anything.
CarPlay
How to see live OBD2 readings such as RPM, boost and coolant temperature on CarPlay, why most apps show a list, which apps draw gauges, and which adapters work with iPhone.
Driving dynamics
What a g force meter for cars reads, how to calculate g yourself, and how many g normal driving, a sports car and Formula One really pull.
Free to download. One vehicle, real features, no ads. Your garage will thank you.
Download WrenchTime on the App Store