Fuel economy
How to improve fuel economy
Driving habits beat every product: smooth driving and lower motorway speeds save the most, tyres, oil and roof racks come next, and gadgets do nothing.
Driving dynamics
A g force meter for cars measures how hard a car speeds up, brakes and corners, in multiples of standard gravity: one g is 9.80665 m/s², about 32.17 ft/s². Researchers only count braking as hard from 0.45 g and a turn as hard from 0.50 g, so everyday driving likely stays under about half a g. Tyre grip on a dry road tops out near 0.7 g, GM rates the Corvette Z06 at 1.2 g, and a Formula One car passes five g in the first corner at Suzuka.
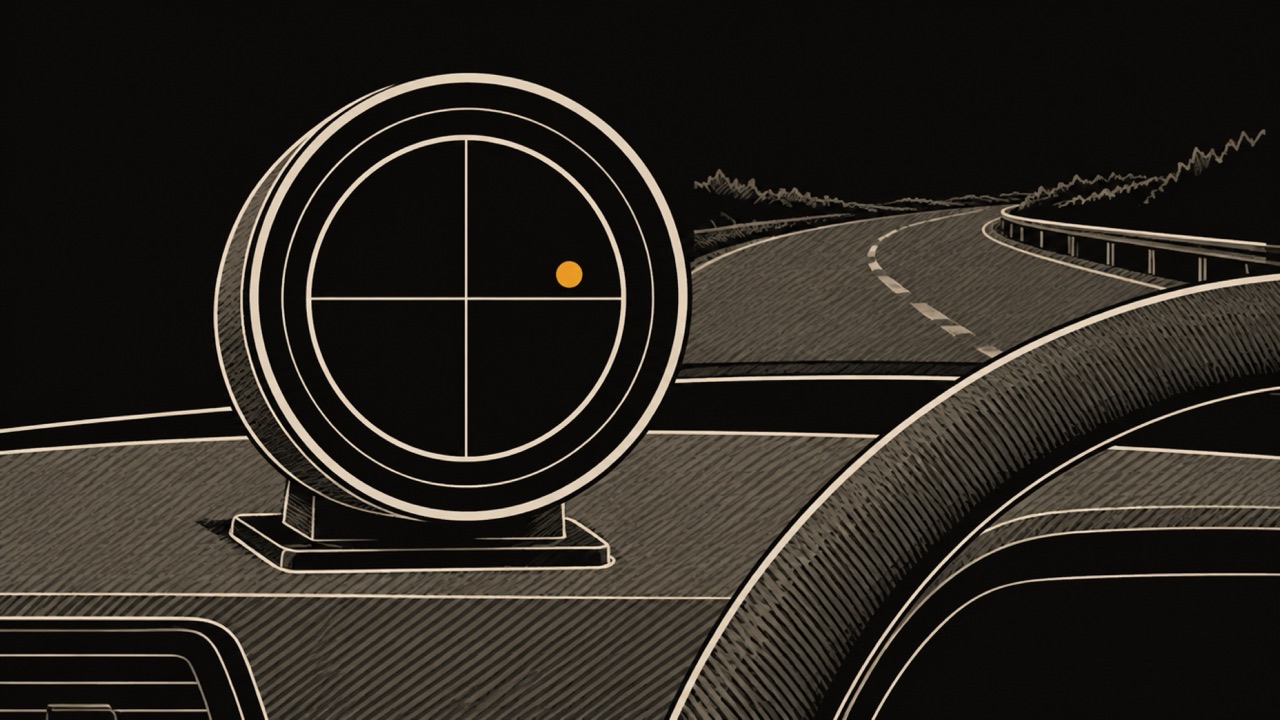
A g meter in a car is an accelerometer with a display that shows the car's acceleration in g. One g is the standard acceleration of gravity, which NIST lists as exactly 9.80665 m/s², or about 32.17 ft/s². A reading of 0.5 g means the car is speeding up, slowing down or turning with half the force that gravity pulls you down with.
A car g force meter reads two axes. Longitudinal acceleration is the forward and backward axis: pressing the accelerator pushes you into the seat, braking throws you toward the belt. Lateral acceleration is the side to side axis you feel in a corner. Most gauges and apps show both at once as a dot moving inside concentric rings.
That plot is called the friction circle, also known as the traction circle or g-g diagram: a picture of the grip your tyres have to share between braking, accelerating and turning. A dot near the centre means little grip in use. A dot near the edge means the tyres are close to their limit, and braking hard while turning hard spends the same grip twice.
The sensor itself feels more than the car. As Apple's Core Motion documentation puts it, an accelerometer measures the sum of two vectors, gravity and the device's own acceleration; Core Motion uses both the gyroscope and the accelerometer to tell them apart. A g meter that is tilted or loosely mounted mixes some of gravity into its reading, which is why mounting and levelling matter.
To calculate g-force in a straight line, divide the change in speed by the time it took, then divide by standard gravity: g = (Δv ÷ Δt) ÷ 9.80665 m/s². Convert mph to metres per second first by multiplying by 0.447, so 30 mph is 13.4 m/s and 60 mph is 26.8 m/s. The same sum gives your average g in a 0 to 60 run, and what is a good 0-60 time works it out for tested cars; our 0 to 60 timer guide covers timing one.
To calculate g-force in a bend, square the speed, divide by the radius of the curve, then divide by standard gravity: g = (v² ÷ r) ÷ 32.17 ft/s². Speed counts twice in that formula, so doubling your speed through the same bend quadruples the lateral g. That is why a corner that feels gentle at 30 mph can be at the tyre's limit at 60 mph.
The worked examples in the table are calculations, not measurements. For instance, a car taking a 50 m radius bend at 30 mph (13.4 m/s) pulls 13.4² ÷ 50 = 3.6 m/s², about 0.37 g.
| Situation | Inputs | Acceleration (m/s²) | g |
|---|---|---|---|
| Gentle stop | 30 mph to 0 in 4 s | 3.4 | 0.34 |
| Firm stop | 60 mph to 0 in 4 s | 6.7 | 0.68 |
| Very hard stop | 60 mph to 0 in 3 s | 8.9 | 0.91 |
| Tight bend | 30 mph, 50 m radius | 3.6 | 0.37 |
| Motorway curve | 50 mph, 200 m radius | 2.5 | 0.25 |
Example calculations with standard gravity from NIST (CODATA 2022): 9.80665 m/s², 32.174 ft/s².
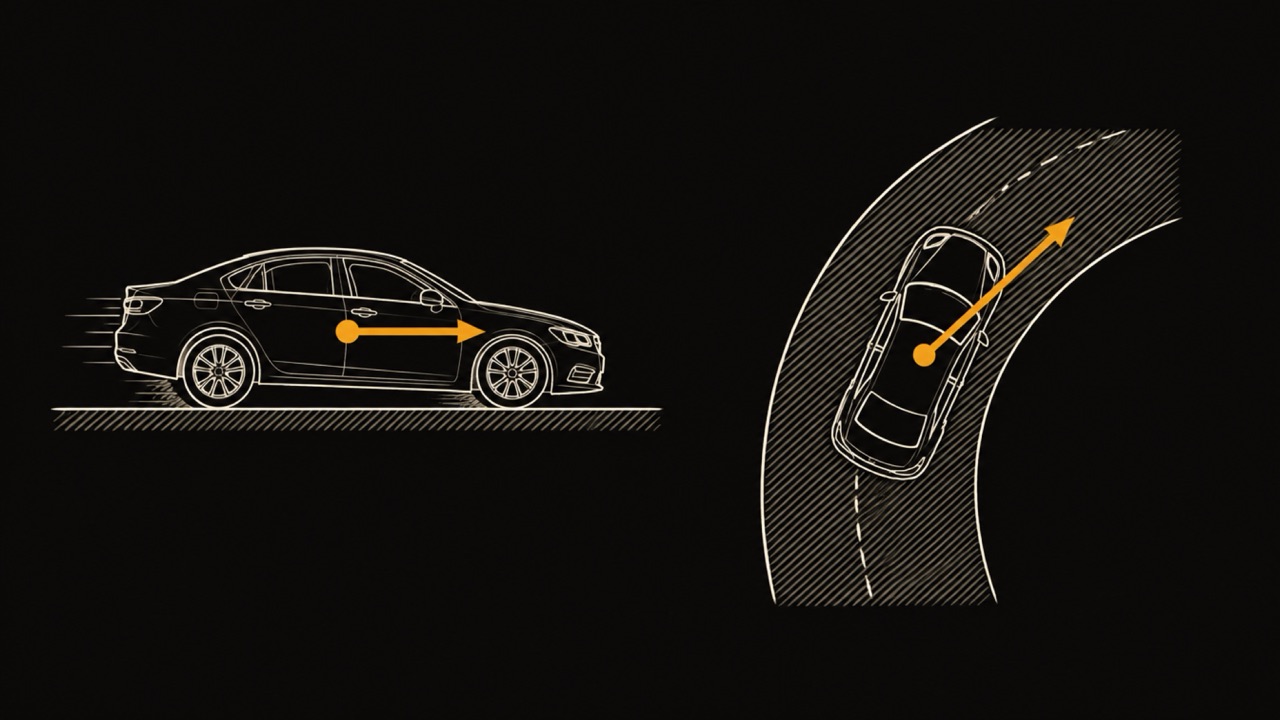
Since researchers only count braking as hard from 0.45 g, a car in normal driving likely stays under about half a g. The Naturalistic Teenage Driving Study, analysed by Simons-Morton and colleagues in Accident Analysis & Prevention (2013, published online in November 2012), flagged braking of 0.45 g or more, starts of 0.35 g or more and turns of 0.50 g or more as elevated g-force events.
The same paper reports, citing the group's earlier 2011 study, that novice teens produced elevated g-force events about five times as often as their parents, in the same cars on the same roads. Those thresholds are triggers for counting events, not safety limits and not a measurement of how an average driver drives. Hard stops and rapid starts are also the habits that cost fuel, which our guide to smooth braking and acceleration covers.
Passenger comfort research lands in the same range. In a test-track study published in 2026 in Transportation Research Part F, 28 occupants sitting in the driver's seat of an automated test vehicle found no single optimal lateral acceleration in curves. About 0.31 g (3 m/s²) often appeared the more balanced option, about 0.41 g (4 m/s²) was frequently too fast and about 0.20 g (2 m/s²) often too slow. It measured comfort on a test track, not normal traffic.
The upper limit for an ordinary car on ordinary tyres is grip. HyperPhysics gives tyre to road friction coefficients of about 0.7 on dry roads and 0.4 on wet ones. On a flat road without downforce, maximum acceleration is roughly the friction coefficient times g, so about 0.7 g dry and 0.4 g wet. Treat it as an estimate: tyres, surface, speed and load all move it.
| Situation | g | Source |
|---|---|---|
| Curve often rated a balanced option, test-track occupants | about 0.31 (3 m/s²) | Peng et al., 2026 |
| Curve often rated too fast, test-track occupants | about 0.41 (4 m/s²) | Peng et al., 2026 |
| Rapid start, research threshold | 0.35 | Simons-Morton et al., 2013 |
| Hard braking, research threshold | 0.45 | Simons-Morton et al., 2013 |
| Hard turn, research threshold | 0.50 | Simons-Morton et al., 2013 |
| Grip limit, wet road (estimate) | about 0.4 | HyperPhysics friction coefficient |
| Grip limit, dry road (estimate) | about 0.7 | HyperPhysics friction coefficient |
| Corvette Z06, maker's figure | 1.2 | GM, via Guide Auto Web, 2014 |
| Formula One, fastest corner of 2024 | over 5 | Mercedes-AMG Formula One team |
Sources: Peng et al., Transportation Research Part F (2026), Simons-Morton et al., Accident Analysis & Prevention (2013), HyperPhysics, Guide Auto Web (2014), Mercedes-AMG Formula One team. Grip limits estimated as friction coefficient times g. Checked October 2026.
Formula One cars pull the highest g of the figures here. The Mercedes-AMG Formula One team says a car generates over five g at the apex of the first corner at Suzuka, the highest lateral g of the 2024 calendar, and up to five g through Eau Rouge at Spa and Maggots-Becketts at Silverstone. For a 70 kg driver, five g is a sideways force of about 350 kg.
Formula One cars go far past the roughly 0.7 g an ordinary tyre allows on a dry road because downforce from their wings presses them into the track, so the faster they go, the more grip they have.
Road cars sit far below that. A fast road car reaches about 1.2 g by its maker's figure: GM said the 2015 Corvette Z06 can generate 1.2 g of lateral acceleration, while the standard Corvette cannot manage more than 1.13 g, as Guide Auto Web reported in 2014. That is the maker's own figure, not a ranking of every road car.
A g-force meter for a car comes in three forms: a dedicated gauge, a display built into the car, or a phone app. All three read the same physics; they differ in how they are mounted and what they record.
To use a g force meter for cars, mount it rigidly, let it level itself or level it by hand, and zero it parked on flat ground. Read it after the drive rather than during it: peak values and counted hard events tell you how smooth your braking, accelerating and cornering were, without taking your eyes off the road. Hard braking, rapid acceleration and cornering are also among the signals usage-based insurance programmes track, so a few weeks of your own counts show how often they happen before anyone else sees them.
On a skidpad or at a track day, the friction circle shows technique. A dot that jumps from the braking axis to the cornering axis means abrupt, separate inputs; a dot that rolls round near the edge means braking blended smoothly into turning.
Never chase g on a public road. Anything close to the grip limit of about 0.7 g on a dry road leaves no margin for a wet patch, gravel or another driver, and it belongs on a closed course with an instructor.
Yes. An iPhone has the two sensors a g meter needs, an accelerometer and a gyroscope, and Apple's Core Motion combines them to separate gravity from the phone's own movement. An app built on that can read g whichever way the phone is mounted, as long as the mount holds it firmly.
WrenchTime, a car and motorcycle log for iPhone, records G-force on every trip it tracks: peak G, peak lateral G, and counted braking, acceleration and cornering events. It fuses GPS Doppler speed with the gyroscope, so the reading holds however the phone is mounted, and the sensitivity for cornering, braking and acceleration is set separately. A motorcycle gets its own cornering profile, because a bike leans through bends a car would never take.
WrenchTime records every drive automatically: detection arms when the car's Bluetooth connects or iOS reports automotive motion, and the trip starts once the car is moving, so the G-force figures arrive without pressing anything. No OBD-II adapter is needed, because the readings come from the phone's own sensors.
On WrenchTime Live, a live G-force instrument shows the reading while you drive, and the cinematic 3D replay of a trip draws a friction circle for G-force along the route.
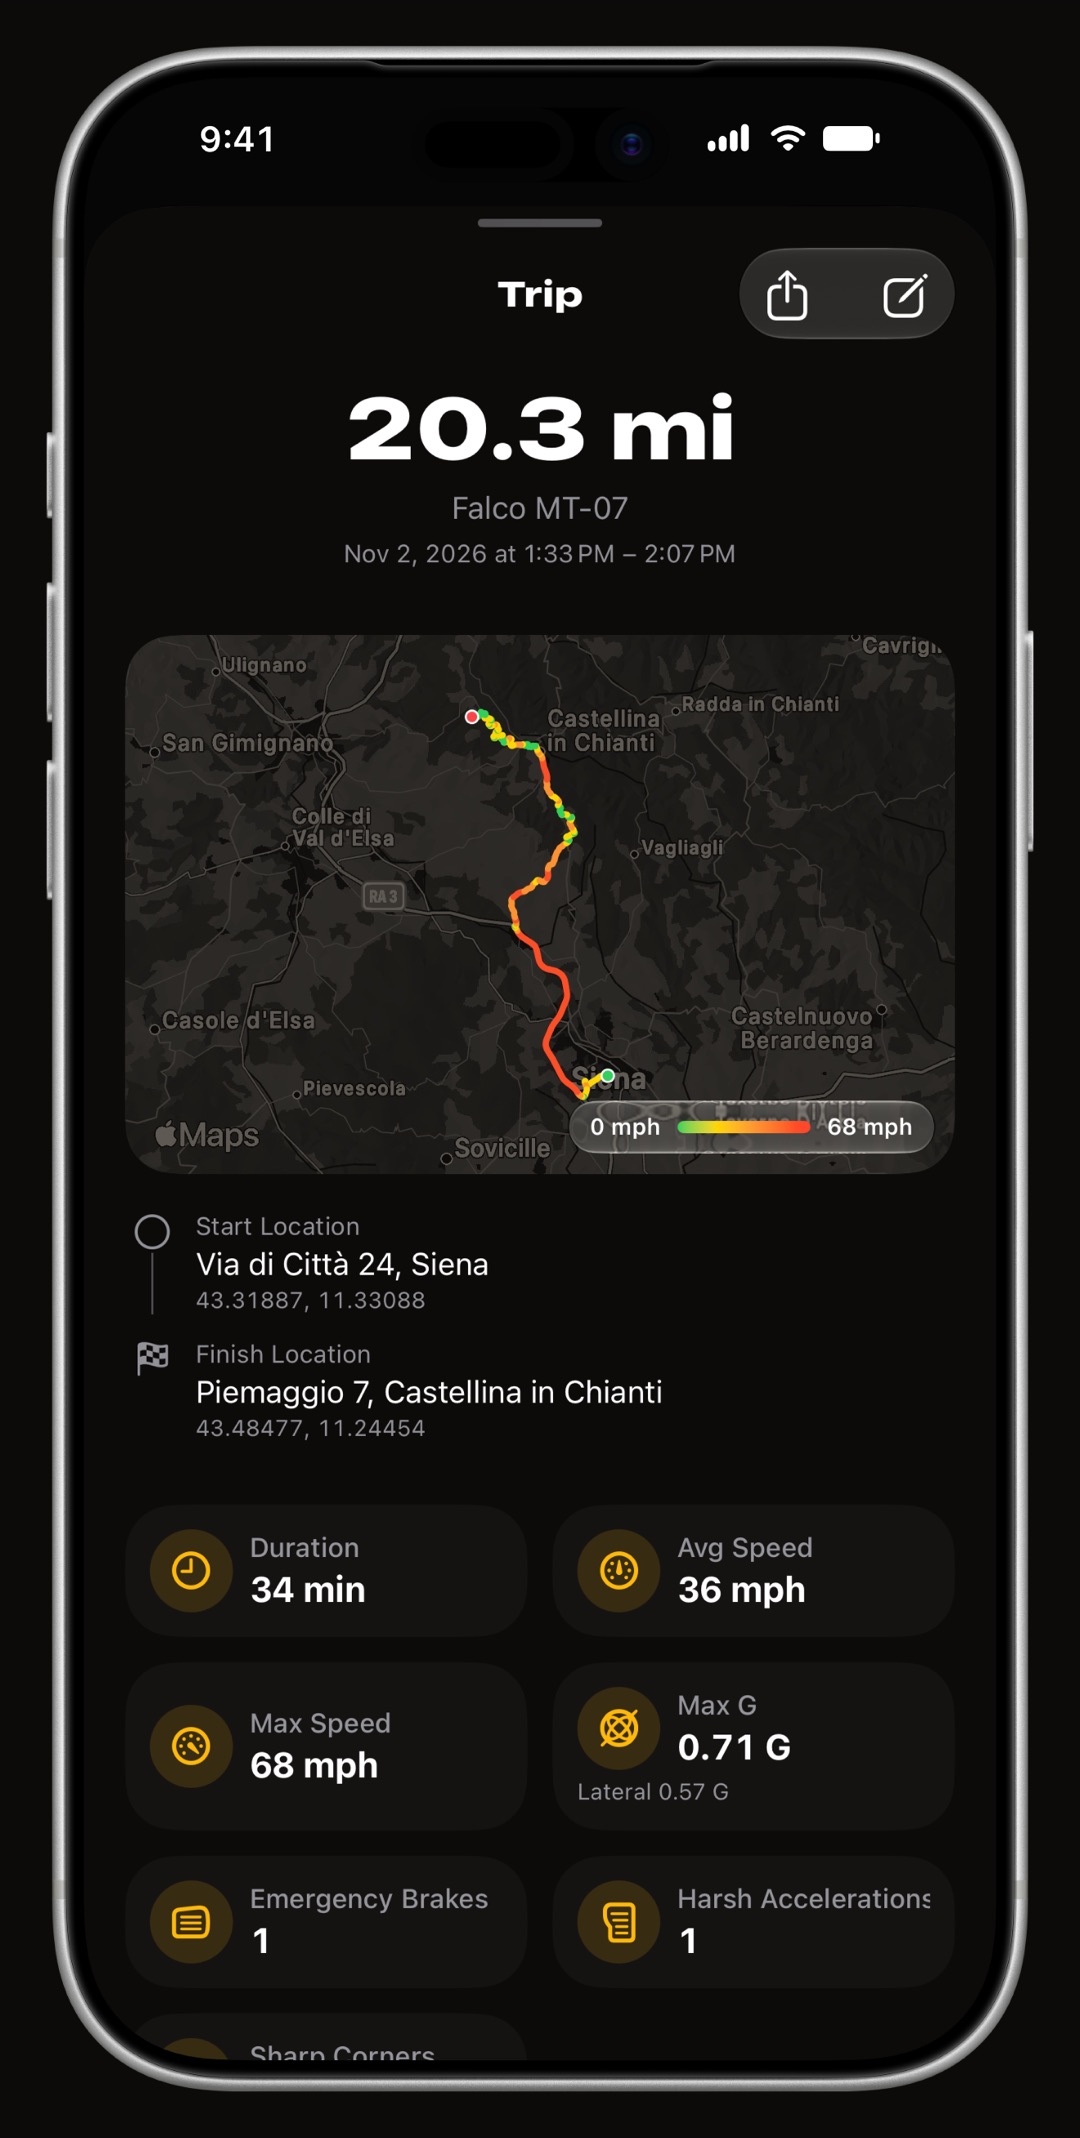
The figures a g force meter for cars shows, in one place.
Drive as you always do and let the trip log count the hard stops and sharp corners for you. WrenchTime records peak G and peak lateral G on each trip it tracks and counts its braking, acceleration and cornering events, from the phone alone. The free version records 10 trips a week and runs 3 WrenchTime Live instruments on the first page. See how the car dashboard app for iPhone shows G-force while you drive.
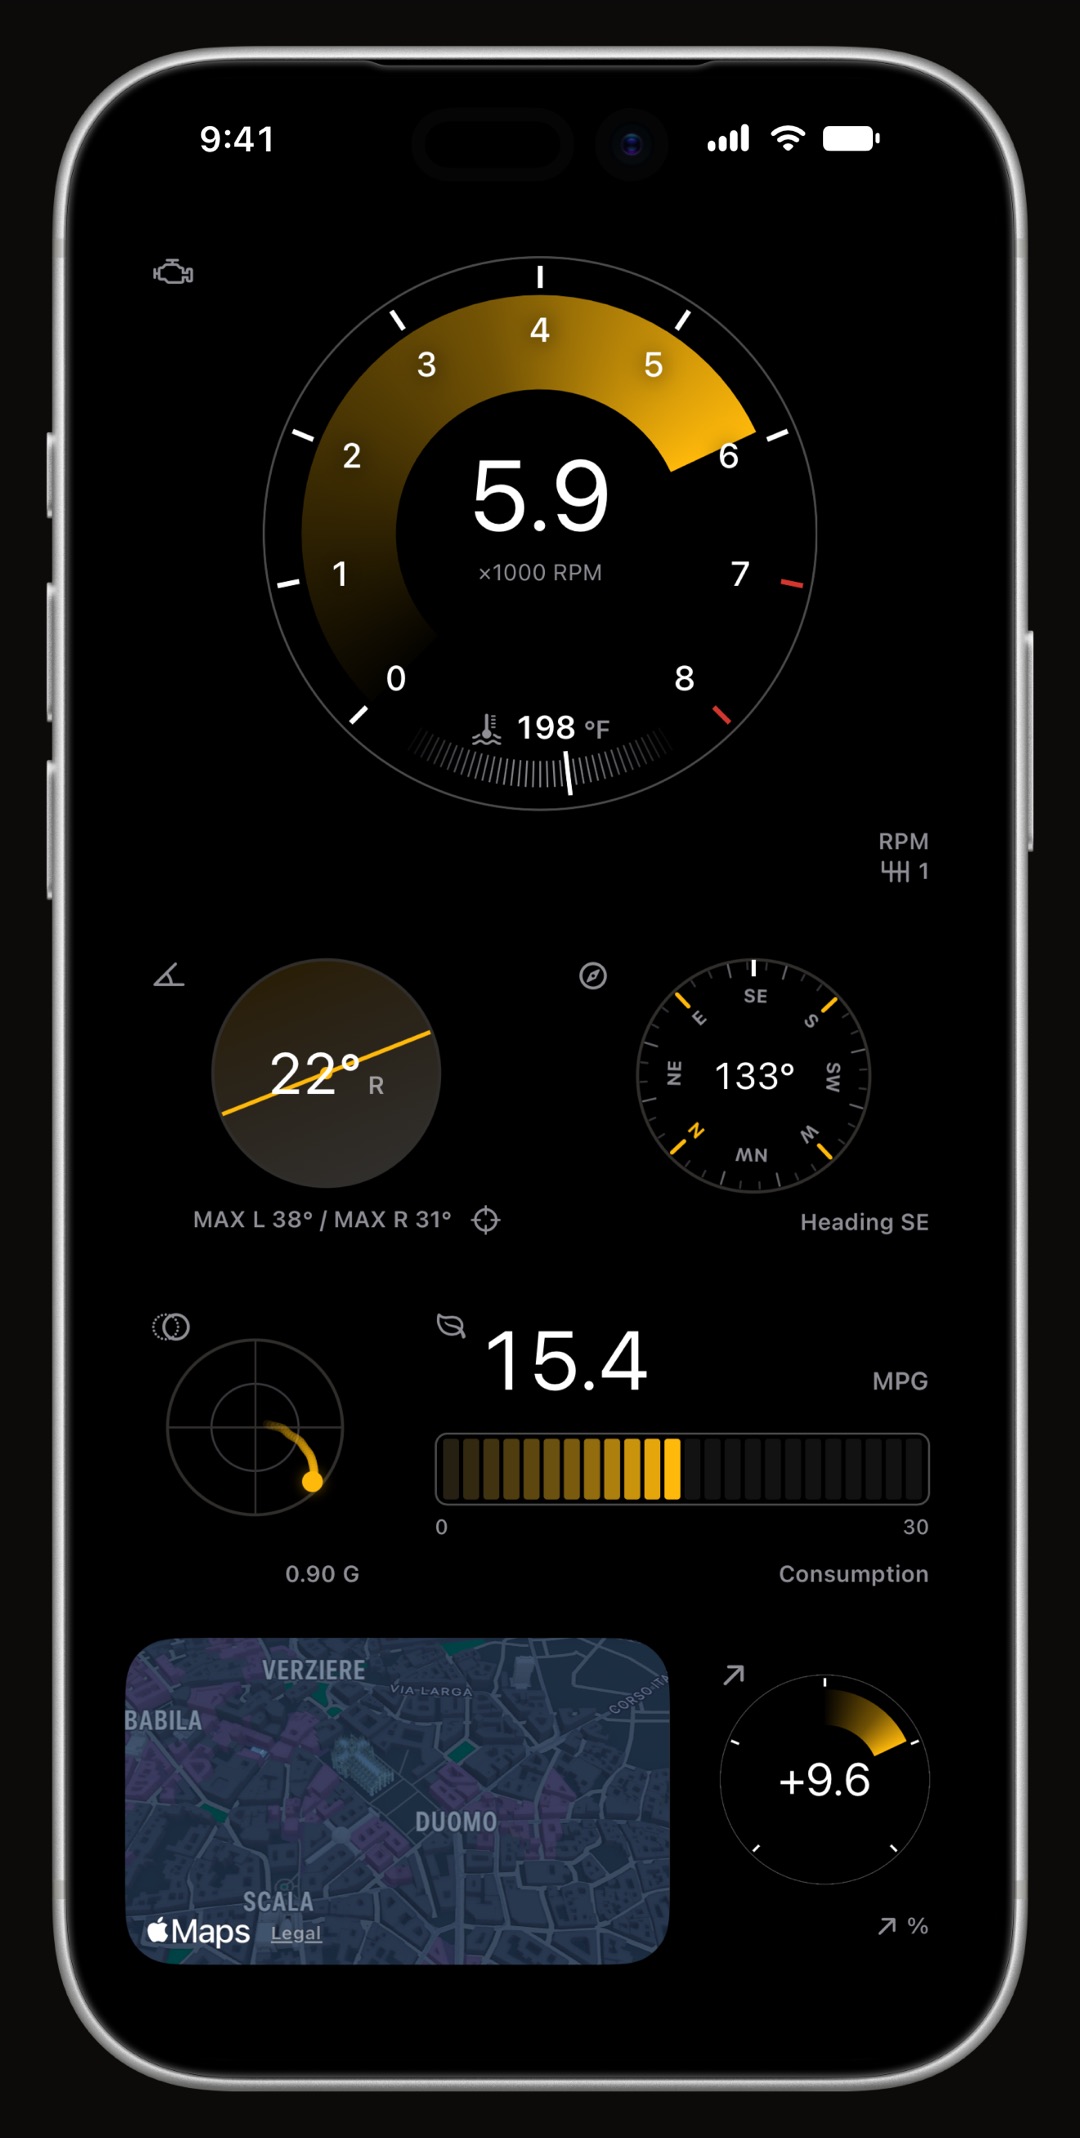
A g meter is an accelerometer display that shows how hard the car accelerates, brakes and corners, in multiples of standard gravity, 9.80665 m/s² according to NIST. Most show two axes, longitudinal for braking and acceleration and lateral for cornering, often plotted together as a dot inside a friction circle.
Divide the change in speed by the time it took, then by 9.80665 m/s². Slowing from 60 mph (26.8 m/s) to a stop in 4 seconds is 6.7 m/s², about 0.68 g. In a bend, square the speed and divide by the radius: 30 mph around a 50 m radius is about 0.37 g.
Everyday driving likely stays under about half a g: researchers count braking as hard from 0.45 g and turns from 0.50 g. Dry-road grip limits an ordinary car to about 0.7 g, GM rates the Corvette Z06 at 1.2 g, and Formula One cars reach about five g in fast corners, passing it at Suzuka's first corner.
Formula One cars, among these figures: the Mercedes-AMG Formula One team says the first corner at Suzuka produced over five g, the highest lateral g of 2024. That grip comes from downforce, which presses the car into the track. A fast road car reaches about 1.2 g by its maker's figure: GM rates the 2015 Corvette Z06 at 1.2 g.
Mount it rigidly, level it, and zero it parked on flat ground. Read peak values and counted hard events after the drive to judge how smooth you are. Save the friction circle and anything near the grip limit for a skidpad or a track day, never a public road.
Yes. An iPhone has an accelerometer and a gyroscope, and Apple's Core Motion uses both to separate gravity from the phone's own acceleration, so an app can read g in any mounting position. How firmly the phone is held and how well the app filters vibration decide how clean the reading is.
More from the blog
Fuel economy
Driving habits beat every product: smooth driving and lower motorway speeds save the most, tyres, oil and roof racks come next, and gadgets do nothing.
Mileage
MileIQ, Everlance, TripLog, Driversnote, Stride and WrenchTime compared on free limits, prices, how a trip starts on its own, and what each one is for.
CarPlay
How to see live OBD2 readings such as RPM, boost and coolant temperature on CarPlay, why most apps show a list, which apps draw gauges, and which adapters work with iPhone.

Free to download. One vehicle, real features, no ads. Your garage will thank you.
Download WrenchTime on the App Store